(Ed note: My intention was to make this an 8 part series. But then, well, times got tough and it never got through the editing and approval process and then, well, I got laid off. Shame too…it was an interesting idea.)
When January’s (ed. note 2023) social pastime became watching (and talking about) the industry layoff numbers (108,500 people lost their jobs in January 2023 alone), I decided that instead of wallowing in a pool of Imposter Syndrome and fear, wondering if it would happen to me and wondering if I was prepared for the worst, I would put that nervous energy to work. There was a story here, there was hope here (there had to be, there just had to be)…and it was up to me to dig it up. A lot of what I do day-to-day is reading and ruminating. I came around to the idea that I would write about how people running businesses handle tough times.
Who Said I’m Paranoid
IT preparation (actually, any preparation) is a result of paranoic forecasting. Preparation is thinking of the absolutely worst scenarios and planning for them. It’s the reason we have fire drills, the reason we test data recovery, the reason we refresh our CPR certifications – so that we are skilled and ready when the opportunity or need arises.
Take, for instance, Y2K. For months we heard about how bad things were going to be when the clock flipped. In reality, when that clock flipped there were a lot of disappointed spectators. Many said, afterward, that the Y2K paranoia was unfounded; a big nothingburger. And they spoke the truth – not because it didn’t happen, but because the world of tech was precisely paranoid enough to prepare for it; thereby avoiding the disaster.
Just Because We’re Paranoid Doesn’t Mean They’re Not Out To Get Us
Evaluating the information you receive from a forecast is a critical step to being able to plan for it. “It can’t happen here,” is a statement that we’ve now seen disproven time and again, especially in recent years. Nothing is off the table anymore.
When you’re evaluating a forecast, it is important to take into account what’s happening in the world around you at this very moment. Look at the economy, for example. Is the economy strong or weak today? Compare the forecast to the past – was the economy strong or weak last year? How did people react just before and during the last economic crisis? What countries were at war last year? What were the weather patterns like last year in the timeframe you’re looking at? And how did people behave given all those seemingly disparate circumstances? Past behavior is a good indicator of future behavior.
You’re not just going to evaluate whether or not a forecast is even possible, but you want to evaluate the veracity of the data itself in the forecast. If there are a lot of puzzle pieces that fit together, even if they come from weak information, they are actually more trustworthy than a single point or two of strong information.
This is a lot to process, I know. It’s why we take time when we do our yearly (or semi-yearly) planning. It takes more than “going by gut” to prepare for difficult times. You have to be wise and you have to be methodical. And sometimes there is so much information that it’s hard to sort it all out.
Sorting Out Forecasting from Predicting
Forecasting is making logical choices based on past events. Your choices may change based on evidence you gather in your process. Predicting is softer, more fuzzy, based on gut. And while forecasting is more predictable, predicting is less predictable (go take a break while your brain repairs itself).
Information overload (or analysis paralysis in the vernacular) is when you simply have so many choices that you become overwhelmed by the sheer magnitude of decisions to make. It happens to pretty much everyone. When this happens to me, I have to take a step back and breathe before I make any decisions. And then I have to employ a tool to help me sort it all out.
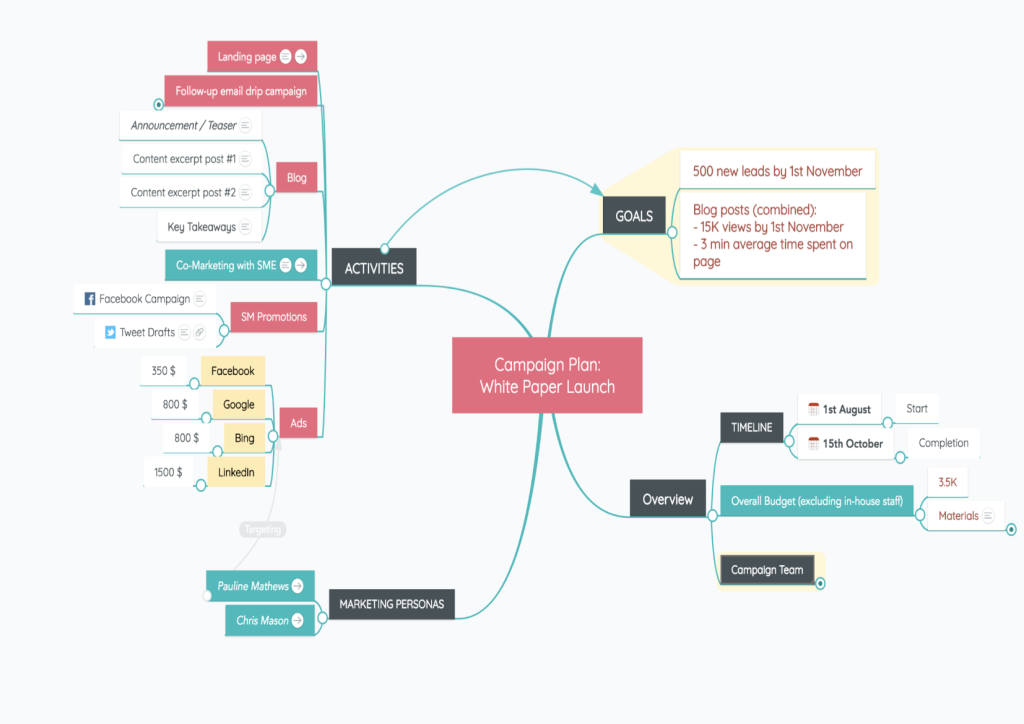
For me, I use the same tool to help me sort out planning and forecasting as I do for sussing out an idea for an article or a business plan. I use a mind map. Maps help you visualize all your data, how they fit together and relate to each other. You may find that you have data that crosses over into multiple areas of concern…those might be noted as having more significance than others data.


I can’t analyze your data, I can only offer this idea as one idea to help you aggregate issues while you plan to minimize the impact of difficult times. There are hundreds of examples of mindmaps for any forecasting situation.
